Havsytehöjningen 2014-05-26
Artikeln finns publicerad i ”Global and Planetary Change” och den publicerades i slutet av förra året och heter ”Trends and acceleration in global and regional sea levels since 1807”. http://www.sciencedirect.com/science/article/pii/S0921818113002750
De visar med hjälp av ”tide gauge records” (mätstationer vi kusten) från 1807 att havshöjningen i genomsnitt var 1,9 mm/år +/- 0,4 mm/år under 1900-talet och 1,8 mm +/- 0,5 mm sedan 1970. Höjdmätarna på satelliterna ger en högre höjning 3,2 till 3,1mm/år. Vilka ger det riktiga värdet satelliterna eller höjdmätarna vi kusterna? Har tidigare läst att höjdmätarna vid kusterna används för att kalibrera höjdmätarna.
Hur säkra är då höjdmätarna på våra satelliter?
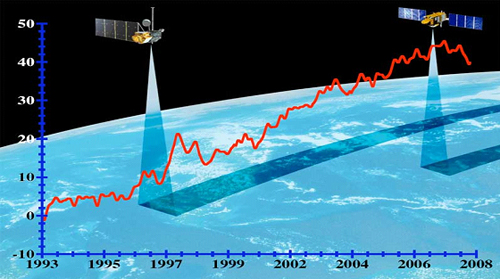
De mäter havsytans förändring genom radarpulser från satelliter på 31 500 meters höjd. Skillnaden har tolkats så att havsytans höjning har accelererat sedan 1993. Se till exempel Wikipedia som säger under rubriken Sea Level Change ”Measurements by TOPEX/Poseidon and Jason-1 show that mean sea level has been rising by about three millimeters (.12 inches) a year since 1993. This is about twice the estimates from tide gauges for the previous century, indicating a possible recent acceleration in the rate of sea level rise.”
Dessa mätningar är mycket känsliga för störningar. Det sägs ”minimum duration of around 10-20 years is required in order to detect a trend with confidence to within 1 mm/yr.
Dessutom använder man sig av datamodellering för att utfrån dagens trender förutsäga framtiden. ”Consequently this report first analyses the sea surface height record from 15 coupled models that have been made available as part of the 5th Coupled Model Intercomparison Project (CMIP5) in preparation for the IPCC's 5th Assessment Report (AR5). Four of the models show no appreciable change in sea level during the 21st century, and three have sea level to be decreasing. In those showing a rise, the predicted sea level by the end of the 21st century could be between 20 and 80 cm above that at its beginning. This does vary with the warming scenario considered, but inter-model differences are the dominant factor. What is striking about these models is that none of them shows a pronounced change in the rate of sea level rise during the period, whereas many models considered during AR4 had shown some acceleration.” Hämtat från” Altimeter accuracy requirements for detecting changes in sea level rise” länk I slutet av bloggposten, av G D Quartly 2012 National Oceanography Centre, SouthamptonUniversity of Southampton Waterfront Campus European Way Southampton.
Alltså sju av de femton modellerna som använts som förberedelse för AR5-rapporten (senaste från IPPC) visar ingen egentlig höjning eller tom minskning. Av de som visar havsytehöjning finns värden mellan 20 – 80 cm.
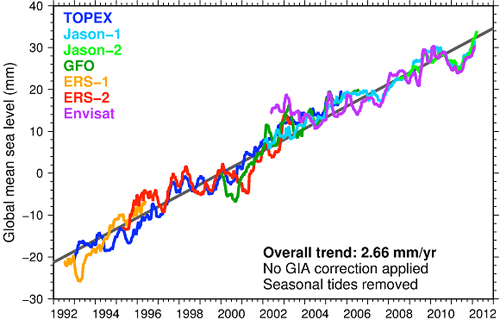
Nedan ser du havsytehöjningen utan GIA, glacial isostatic adjustment, vilket betyder ” The effect is that currently some land surfaces are rising and some ocean bottoms are falling relative to the center of the Earth (the center of the reference frame of the satellite altimeter). Averaged over the global ocean surface, the mean rate of sea level change due to GIA is independently estimated from models at -0.3 mm/yr (Peltier, 2001, 2002, 2009; Peltier & Luthcke, 2009). The magnitude of this correction is small (smaller than the ±0.4 mm/yr uncertainty of the estimated GMSL rate), but the GIA uncertainty is at least 50 percent. However, since the ocean basins are getting larger due to GIA, this will reduce by a very small amount the relative sea level rise that is seen along the coasts. Hämtat från http://sealevel.colorado.edu/content/what-glacial-isostatic-adjustment-gia-and-why-do-you-correct-it
Så i nedanstående figur får du räkna bort ungefär 0,3mm. Vilket blir 2,36 +/- något.
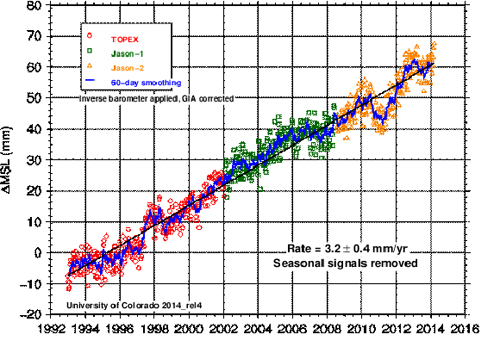
I Coloradouniversitets figur har man 3,2mm +/- 0,4 mm och då är GIA redan borträknat. En skillnad på nästan 1 mm/år. Det är svårt med satelliternas höjdmätare, de är mycket känsliga för störningar och det behövs många beräkningar för att nå fram till ett värde. I rapporten ovan sägs det också ”it is worth noting that a wide range of forecasts do exist in the scientific literature”.
Hur satelliter navigerar.
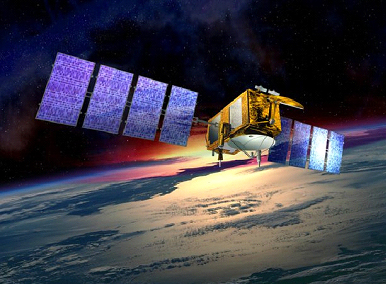
Jason 2, närbild på satelliten.
Länk till rapporten om känsligheten med satellitmätningar.
http://www.google.se/url?sa=t&rct=j&q=&esrc=s&frm=1&source=web&cd=9&cad=rja&uact=8&ved=0CHcQFjAI&url=http%3A%2F%2Feprints.soton.ac.uk%2F339804%2F1%2FNOC_R%2526C_15.pdf&ei=HqSBU96AAufgygOA5YCIDQ&usg=AFQjCNGAf7IDXOR8p4DJ4BgnRNmC2Rqd2Q